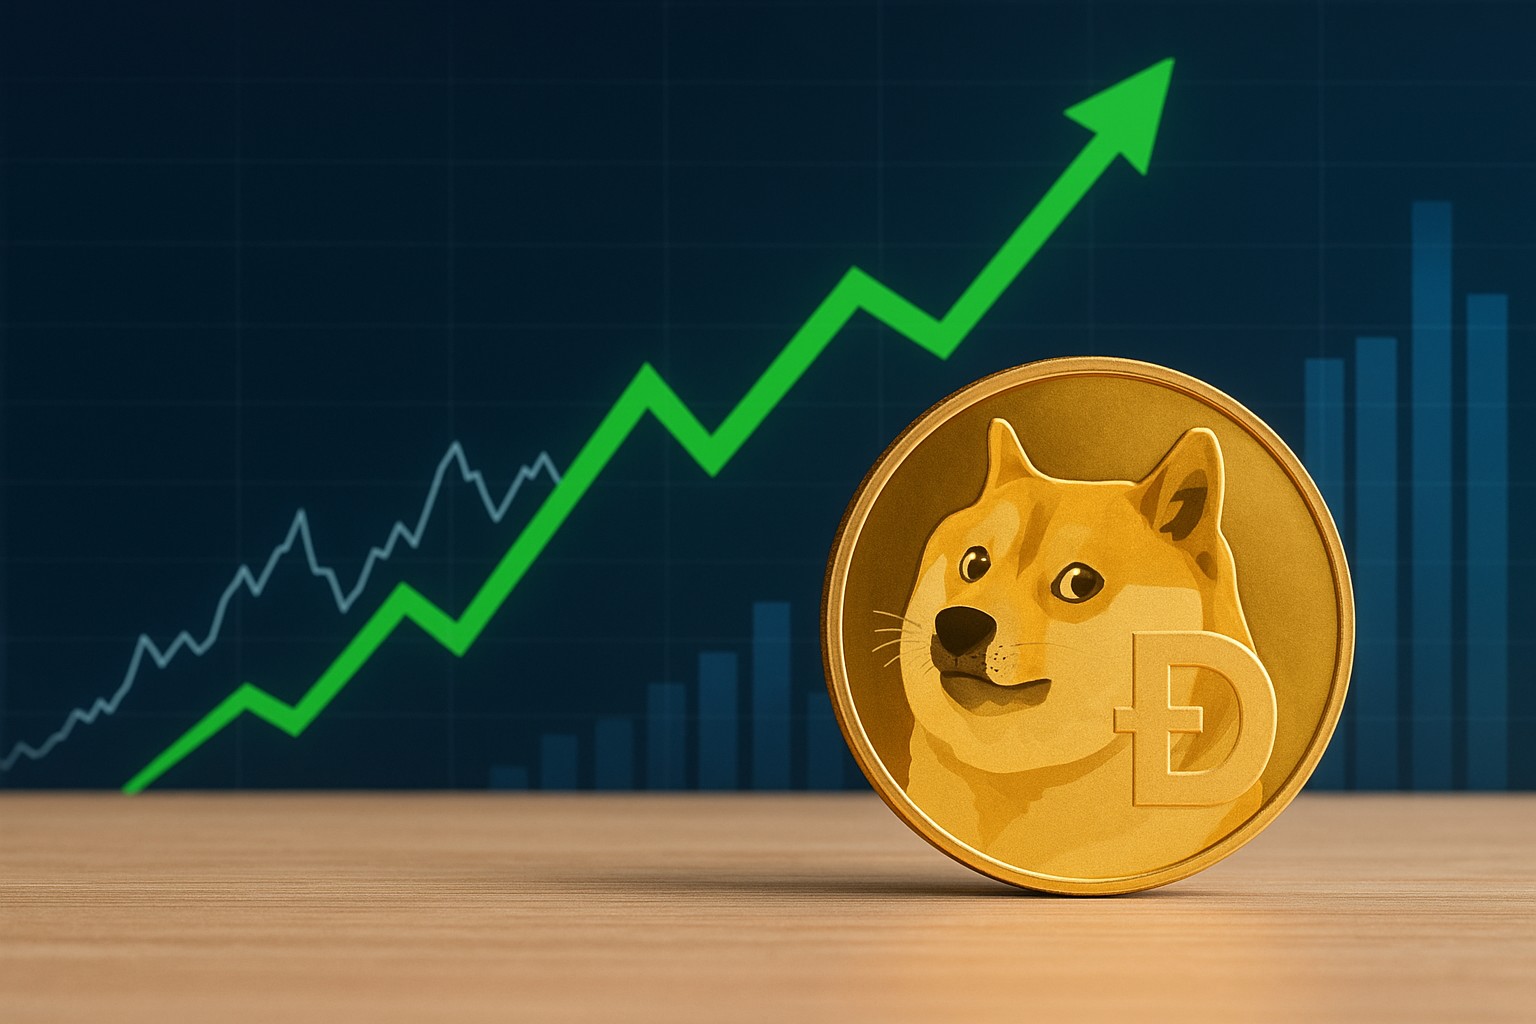
Dogecoin could see a recovery leg after a rare chart reversal as open interest reaches new highs. That combination of a potential bottoming pattern and derivatives demand often precedes sharp, trend-defining moves—though it can also amplify downside if the breakout fails.
Market recap: why DOGE is back on traders’ radar
Dogecoin has spent long stretches oscillating around a psychologically important “round-number” zone, and that matters because memecoins tend to attract momentum capital around clean levels like $0.10. When DOGE repeatedly fails or reclaims those levels, it creates a narrative fuel loop: spot buyers look for a bargain while derivatives traders position for a squeeze.
What’s different this time is the mix of chart structure and positioning. A rebound after a steep dip can be routine, but a rebound that lines up with a widely watched reversal pattern and simultaneous growth in futures activity becomes harder for the market to ignore. In my experience, this is when DOGE stops behaving like a sleepy alt and starts trading like a headline-driven instrument again.
That doesn’t mean an uptrend is guaranteed. It does mean you should treat the next few key levels and funding/positioning data as actionable signals rather than background noise.
Dogecoin price prediction: understanding the “rare chart reversal” (double bottom mechanics)
A “rare chart reversal” for Dogecoin is most commonly discussed as a double bottom or double-bottom-like structure. The idea is straightforward: price tests a support zone twice, sellers fail to push significantly lower on the second attempt, and the market then targets a breakout above the pattern’s neckline (the swing high between the two lows). Whether you call it a textbook double bottom or a looser basing formation, the core message is the same: downside momentum is stalling where it previously accelerated.
The most practical takeaway for readers is not the pattern name—it’s the decision points. The pattern is typically considered higher-quality if:
– The second low holds near the first low without a clean breakdown
– The bounce from the second low shows improving volume or breadth
– The neckline is reclaimed on strong spot participation, not only leverage
If DOGE breaks above its neckline zone and holds it on retests, traders often project a measured move based on the height of the pattern (neckline minus the lows). That’s why you’ll see “target bands” circulating rather than a single number; the market rarely moves in a straight line, and DOGE is especially prone to overshoots and shakeouts.
Confirmation checklist (what I personally watch before calling it “real”)
- Neckline reclaim and daily close: A wick above resistance is less meaningful than a close above it.
- Retest behavior: The best breakouts often retest the neckline and bounce quickly.
- Momentum + participation: Rising spot volume alongside improving RSI/MACD-type momentum is more convincing than leverage-only pops.
- Invalidation level: A breakdown below the second-bottom area (or recent swing low) often negates the bullish thesis.
Open interest reaches new highs: what derivatives data is really telling you
When open interest (OI) reaches new highs, it signals that more contracts are being opened and capital is being committed to a directional view. For DOGE, this can be particularly influential because memecoin rallies often involve fast rotations from spot into perpetual futures, where leverage magnifies both upside bursts and liquidation cascades.
However, rising open interest alone is not “bullish.” It’s a pressure gauge. If price rises with OI, you’re often seeing trend participation and fresh risk being added—potentially supportive, but also more fragile if the move reverses. If price falls while OI rises, that can hint at aggressive shorting or trapped longs adding to losers, depending on funding and liquidation data.
To interpret OI responsibly, pair it with:
– Funding rates: Positive funding can indicate long bias; overly positive funding can foreshadow a long squeeze.
– Liquidations: Large short liquidations during a breakout can accelerate upside; large long liquidations can create sudden dumps.
– Spot-to-perps relationship: If perps lead and spot lags, rallies can fade quickly. If spot demand follows, the move tends to be sturdier.
In short, open interest reaching new highs can validate that Dogecoin is “in play” again—but it also means risk management matters more than usual because the market becomes more sensitive to quick reversals.
Key levels and scenarios: mapping a realistic recovery leg
A recovery leg is best approached as a set of scenarios rather than a single forecast. DOGE typically respects obvious levels—prior swing highs/lows, round numbers, and zones that previously triggered high volume. That creates natural areas where traders take profits, add exposure, or flip bias.
A practical framework looks like this:
– Base support zone: Where buyers defended twice (or repeatedly). If DOGE loses this area on a daily closing basis, bullish reversal talk becomes less credible.
– Neckline / pivot resistance: The “prove it” level. A reclaim and hold often invites trend followers.
– Upper resistance band: The area where prior breakdowns occurred and where late longs may exit at breakeven.
If DOGE clears the pivot area and then forms higher lows, the recovery leg can evolve into a trend. If it fails at the pivot and rolls over, you often get a choppy range where breakouts repeatedly fail—common memecoin behavior during uncertain macro periods.
My personal note: DOGE tends to punish impatience. Many traders get the direction right but the timing wrong, buying the first green candle into resistance. Waiting for confirmation (close above, retest, and hold) often improves outcomes even if it means “missing” the very bottom.
Technical analysis meets catalysts: what could drive follow-through?
Dogecoin rarely moves on technicals alone for long. The chart sets up the possibility; follow-through often needs a catalyst—sometimes crypto-wide (Bitcoin momentum, risk-on macro), sometimes memecoin-specific (social buzz, exchange promotions), and sometimes idiosyncratic (high-profile commentary that reignites attention).
Two dynamics are worth watching because they tend to determine whether a reversal becomes a sustained leg:
1. Liquidity conditions: If broader crypto liquidity is expanding, DOGE rallies can extend further than expected. If liquidity tightens, memecoins are usually the first to fade.
2. Narrative alignment: DOGE performs best when it fits a broader narrative—memecoin rotation, retail return, or a wave of speculative appetite.
It’s also important to separate short-term pumps from durable shifts in market structure. A single-day surge can be mostly liquidation-driven. A multi-week grind higher with higher lows, improving spot volume, and cooling funding is a healthier profile for a sustained recovery.
Risk management for a high-OI environment (practical playbook)
A market with rising open interest can move faster than your plan. Whether you’re trading or investing, it helps to define your risk before you define your target. DOGE can be rewarding, but it’s also notorious for sudden wicks that trigger stops and then reverse.
Here are practical ways to approach it:
– Use invalidation-based sizing: Decide where your thesis is wrong first, then size the position so that a stop-out is tolerable.
– Avoid chasing vertical candles: In high-OI markets, late entries can become liquidity for better-positioned traders.
– Scale entries and exits: Taking partial profits into resistance and leaving a runner reduces emotional decision-making.
– Watch funding and OI together: If funding spikes aggressively while OI surges, be cautious—crowded longs can unwind violently.
– Prefer spot for longer horizons: If you’re aiming for weeks/months, spot reduces liquidation risk compared to high leverage.
Common mistakes I see (and how to avoid them)
- Over-leveraging because the pattern looks clean
- Use smaller leverage or none; patterns fail, especially in memecoins.
- Ignoring the retest
- Waiting for a retest often reduces false breakout risk.
- Confusing open interest with “smart money buying”
- OI is participation, not direction; validate with price action and funding.
Conclusion: a recovery leg is plausible, but confirmation matters
Dogecoin could see a recovery leg after a rare chart reversal as open interest reaches new highs, and that setup is exactly the kind that can produce a fast move if the neckline breaks and holds. Still, high OI cuts both ways: it can fuel a squeeze higher, or it can create a fragile, liquidation-prone rally that snaps back.
If you take one action step from this analysis, make it this: treat the neckline/pivot area and the prior low as your two anchors. A confirmed breakout with supportive spot participation improves the odds of continuation; a rejection and breakdown shifts the odds back toward range-bound chop or renewed weakness.


