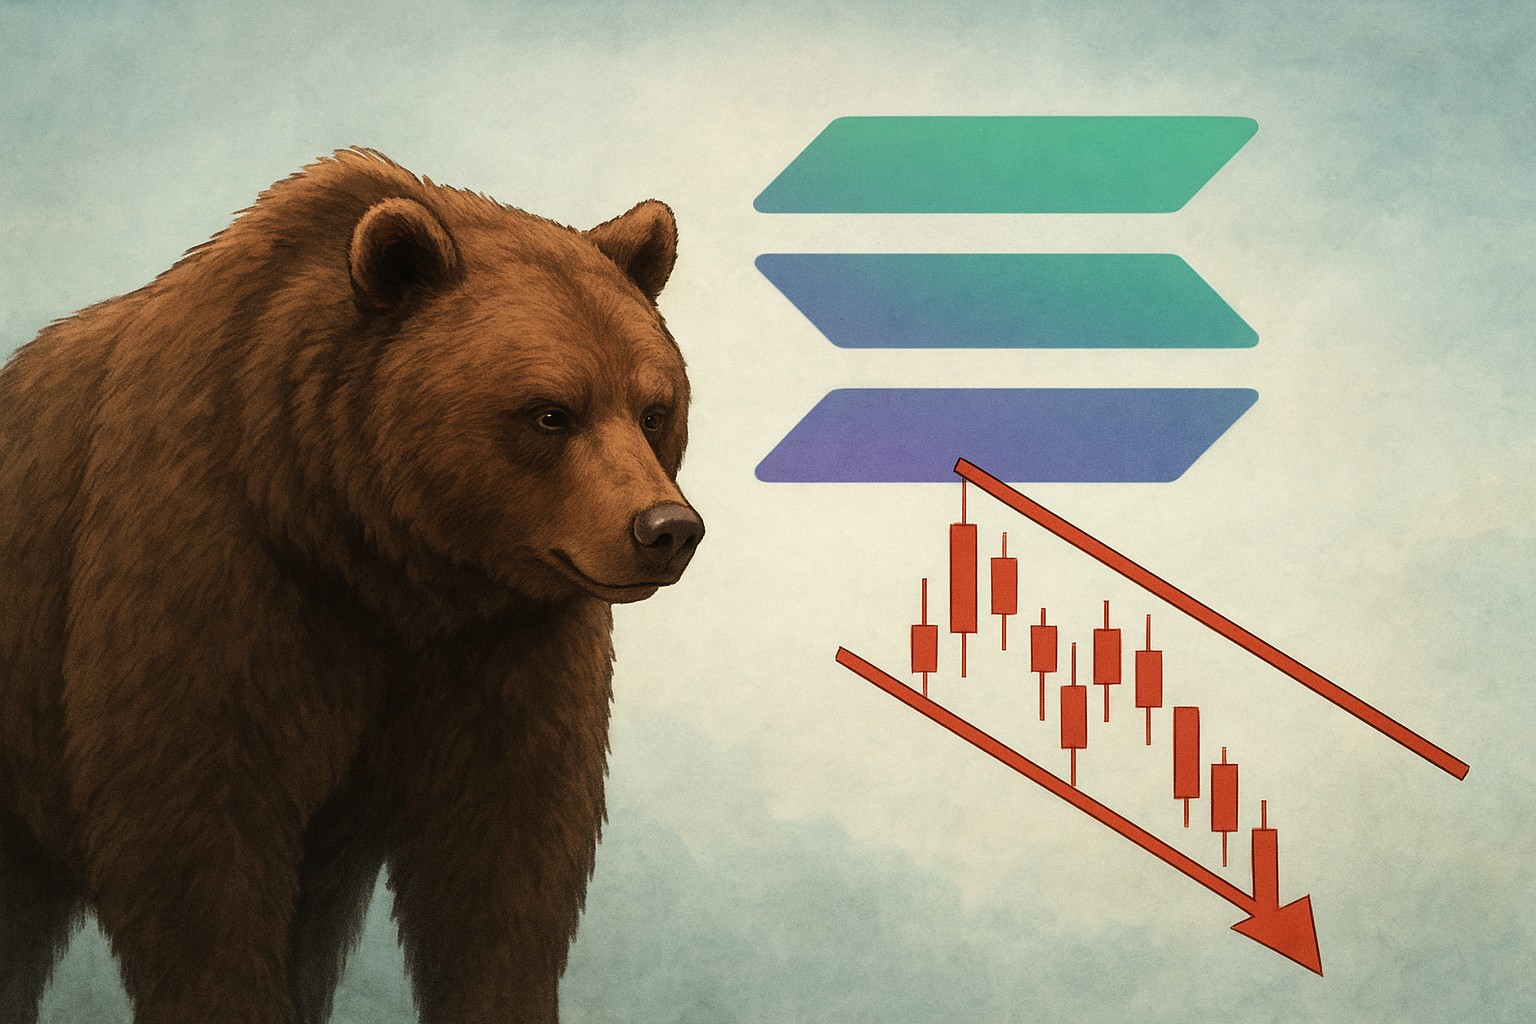
Are bears gaining control as Solana prints a bearish flag on a key timeframe. The setup matters because a bearish flag often appears mid-trend, and it can turn a slow bleed into a sharper move if key support levels fail.
What the bearish flag on Solana actually signals (and why the timeframe matters)
A bearish flag is a continuation pattern: price drops strongly (the flagpole), then pauses in a slightly upward or sideways channel (the flag). If that “rest” breaks down, it frequently resumes the prior downtrend. The crucial detail is the timeframe—signals on the daily or weekly chart generally carry more weight than smaller intraday patterns because they reflect broader positioning and investor behavior.
In Solana’s case, traders tend to watch the daily structure for entries and the weekly structure for confirmation. When the flag forms beneath prior support-turned-resistance, it suggests sellers are defending rallies rather than capitulating. That doesn’t guarantee a breakdown, but it raises the probability that any bounce is corrective unless bulls reclaim major levels with conviction.
Personally, I treat bearish flags as “risk alerts,” not instant sell signals. They become actionable when price compresses toward the end of the flag and liquidity clusters build below support—exactly where stop losses and liquidation cascades can accelerate a move.
Solana price analysis: key support, resistance, and invalidation levels
A practical Solana price analysis starts with three zones: (1) the breakdown level (flag support), (2) the nearest resistance ceiling (flag top / prior pivot), and (3) the next major support beneath the flagpole low. You don’t need to predict; you need to map what would prove you right or wrong.
If SOL loses the flag’s lower boundary on a daily close, many traders interpret it as confirmation of bearish continuation. The next question becomes: where is the next dense liquidity pocket? That’s often near previous swing lows, round numbers, and high-volume nodes on the volume profile. Those areas can produce temporary bounces even in a downtrend—useful for risk management, not necessarily trend reversal.
Invalidation is equally important. A strong reclaim above the flag’s upper boundary—followed by holding it as support—often neutralizes the bearish thesis. In other words, if bulls can flip resistance into support with expanding volume, the bearish flag stops being a “continuation” pattern and starts looking like a base.
On-chain and fundamentals: network revenue, TVL, and what they imply for SOL demand
Technical patterns hit harder when fundamentals are weakening because fewer buyers step in to defend levels. For Solana, two on-chain metrics commonly used to gauge activity and stickiness are network revenue and TVL (total value locked). When both trend down together, it can hint that speculative activity is cooling and that capital is rotating elsewhere.
That said, context matters. Revenue can dip because fee markets normalize after hype cycles, and TVL can fall due to broader risk-off conditions rather than chain-specific failure. A disciplined read is to compare Solana’s changes to the wider market: is SOL underperforming peers? Are stablecoin balances on Solana shrinking? Are DEX volumes fading or just stabilizing?
From a practical standpoint, I like to watch whether usage declines while developer momentum and product releases remain steady. If builders keep shipping and user activity later recovers, the chart damage can reverse quickly. But if activity continues to deteriorate while price is trapped under resistance, bearish technicals tend to “work” more often.
Derivatives and positioning: open interest, funding, and liquidation risk
Derivatives can amplify a bearish flag because leverage creates forced flows. When open interest grows during a downtrend, it can mean traders are piling into positions; when it shrinks, it can mean de-risking and lower liquidity—both can produce sharp moves, just in different ways. Add funding rates and you get a clearer picture of whether the crowd is leaning too hard.
What to monitor in SOL futures before and after a breakdown
- Open interest vs. price: rising OI with falling price can indicate aggressive shorting or trapped longs; falling OI can suggest positions are being closed and volatility may spike on thin liquidity
- Funding rates: persistently negative funding may imply crowded shorts; a sudden funding flip can precede short squeezes
- Liquidation clusters: large pools of liquidation levels just below support can accelerate a breakdown; clusters above resistance can fuel a squeeze if bulls reclaim levels
- Basis and spreads: widening spreads and weak perp basis can signal stressed liquidity conditions
In my experience, the highest-quality breakdowns happen when price breaks support, funding is not extremely one-sided, and spot selling confirms the move. The most dangerous setups for bears happen when everyone is already short and a single catalyst triggers a squeeze through resistance.
Macro and risk sentiment: why external shocks can decide the next SOL move
Crypto rarely trades in a vacuum. Even a clean bearish flag can fail if macro conditions turn supportive—think falling yields, dovish central-bank messaging, or a relief rally in equities. Conversely, geopolitical stress, commodity spikes, or renewed inflation fears can push investors away from risk assets, and SOL often reacts with higher beta than the market.
This is where many traders get blindsided: they do everything right technically, but ignore the calendar. Major economic prints, central bank meetings, and sudden geopolitical headlines can turn a tidy consolidation into a gap-like move. If you’re trading SOL around a bearish flag, position sizing matters more than being “right” on direction.
A simple approach is to treat macro as a volatility multiplier. If volatility drivers are rising, reduce leverage, widen invalidation buffers, and prioritize spot over perps. You can still have a bearish thesis, but you avoid being forced out by a headline wick.
Scenarios and strategy: if bears take control vs. if bulls reclaim the trend
If bears truly are gaining control, the typical path is: breakdown from the flag, retest of the broken support as resistance, then continuation toward the next major support zone. Traders often look for a weak bounce on declining volume as a confirmation that buyers are not stepping in with enough force. In that scenario, risk management is about avoiding overconfidence—continuation trends can still snap back violently.
On the bullish side, the playbook is clear: bulls need to invalidate the bearish flag by reclaiming the upper boundary and holding it. Ideally, that reclaim comes with expanding spot volume and improving market breadth. If SOL can form higher lows and flip key moving averages back into support, the bearish pattern becomes less relevant and the focus shifts to rebuilding structure.
If you’re not actively trading, a long-term investor can still use this information. Consider staged entries (dollar-cost averaging) near major supports, but only if your thesis is multi-month and you can tolerate drawdowns. For shorter horizons, waiting for confirmation—either breakdown + retest or reclaim + hold—often beats guessing the midpoint.
Conclusion: Is Solana at risk, or is this bearish flag a trap?
A bearish flag on a key timeframe is a legitimate warning sign, especially when combined with softening on-chain metrics and cautious risk sentiment. It doesn’t guarantee a crash, but it does argue for respecting support levels, watching derivatives positioning, and defining invalidation clearly.
Whether bears gain control from here depends on confirmation: a decisive breakdown and failed retest favors continuation lower, while a strong reclaim above the flag structure shifts odds back toward bulls. If you take one actionable idea away, make it this—plan two scenarios in advance and size positions so that a surprise catalyst doesn’t make the decision for you.