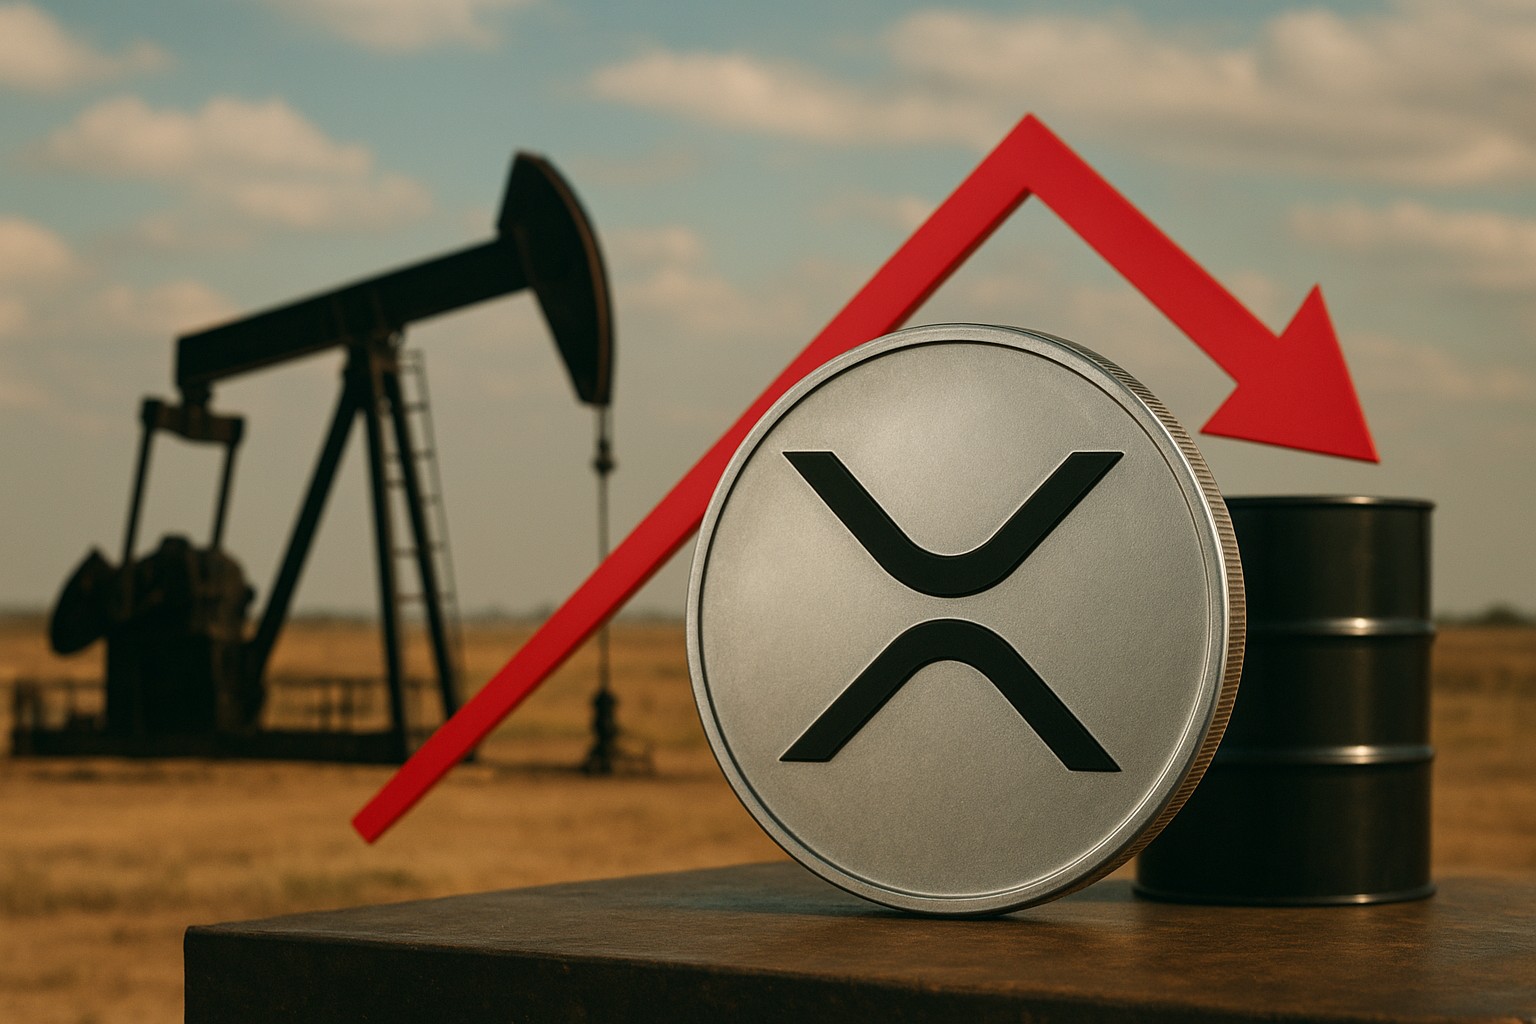
Will XRP stay above $1.35 after the 400M barrel crude release shakes markets is the question traders are quietly pricing in as macro headlines whip risk appetite. Oil’s sudden reversal can ripple into crypto via inflation expectations, liquidity, and the U.S. dollar—right where XRP’s $1.35 line matters.
What the 400M-barrel crude release means for crypto risk sentiment
The reported possibility of a coordinated strategic crude release (up to 400 million barrels) matters less for oil traders alone and more for what it signals about inflation and policy. When energy prices cool quickly, markets often reprice the path of rate cuts, bond yields, and the dollar—inputs that can either support or squeeze speculative assets like crypto.
In practice, a large crude release can act like a pressure valve: it reduces near-term inflation fear, which can stabilize equities and crypto if investors interpret it as policy-friendly. The catch is that abrupt macro reversals also trigger de-risking in the short run, especially if the move exposes how crowded positioning is across assets. That can lead to a few sessions where correlations rise and charts look more technical than fundamental.
From a trader’s seat, I treat this kind of headline as a volatility event rather than a long-term thesis. It can create clean levels and clearer invalidation points—exactly what XRP needs while hovering near $1.35, a price that’s as much psychology as it is market structure.
XRP price analysis: why $1.35 is a make-or-break line
In a straightforward XRP price analysis, $1.35 stands out because it sits at the intersection of recent consolidation and the lower edge of a widely watched support band. When price repeatedly reacts at one area, it becomes a decision point: buyers defend it to prove trend health; sellers press it to confirm weakness and force stop-losses.
If XRP keeps printing closes above $1.35, it signals that demand is absorbing supply even as macro headlines churn. That doesn’t automatically mean a rally, but it often means volatility compresses into a tighter range—setting up a cleaner breakout attempt later. If it loses $1.35 decisively, the market tends to “seek liquidity” below, often tagging the next obvious floor where buyers previously stepped in.
Context matters: XRP has spent long periods trading as a range asset, where key levels can outperform indicators. In other words, support and resistance frequently tell the story sooner than narratives do—especially during macro-driven whipsaws like the one triggered by the crude release chatter.
Key support and resistance levels to watch this week
Support and resistance levels are the practical map here. Traders don’t need perfect predictions; they need zones that define risk and prevent emotional decisions during fast candles. The $1.35 area is the headline, but it’s not the only level that matters.
A common structure around this zone is: a defended base (around $1.35), an “air pocket” below (where price can drop quickly if stops trigger), and a ceiling above (where sellers have recently shown up). If XRP reclaims the upper boundary with conviction, it often changes the conversation from defense to expansion.
Actionable levels and what they imply
- Immediate support: $1.35
Holds suggest buyers are still active; repeated bounces can build a springboard for a move higher. - Secondary support: $1.30 (risk zone)
A break below $1.35 often targets this next, as it’s a natural magnet for bids and prior reactions. - Near resistance: $1.40
A close above tends to shift short-term control back to bulls and can trigger momentum entries. - Upside pivot: $1.47 area
If price clears nearer resistance and retests successfully, this becomes a realistic next stop for a swing move.
As a personal note: I like to watch how price behaves on retests more than the initial break. XRP can be prone to quick wicks through levels. A clean reclaim of $1.35 after a dip is often more informative than a first touch bounce, because it shows buyers are willing to defend under pressure.
Macro catalysts that could decide whether $1.35 holds
The crude-release storyline influences XRP indirectly through the usual macro chain: inflation expectations → yields → dollar → risk appetite. If oil cools and yields drift lower, crypto can breathe. If the move is interpreted as a sign of deeper geopolitical risk or policy uncertainty, the market can still tighten financial conditions via a stronger dollar and a bid for safety.
Beyond oil, traders should watch the calendar: U.S. CPI/PPI surprises, Fed commentary, and any sudden repricing in rate expectations can overwhelm coin-specific factors. XRP’s sensitivity is often highest when it’s sitting on a widely visible level like $1.35, because macro volatility can “choose the direction” for a coiled chart.
There’s also the crypto-native layer: overall market leverage, Bitcoin’s direction, and risk-on sentiment in altcoins. If Bitcoin stabilizes while macro fear cools, XRP has a better chance of holding support simply because the whole complex stops bleeding. If BTC breaks down, $1.35 becomes harder to defend regardless of oil.
XRP price prediction scenarios: bullish, bearish, and base case
Any XRP price prediction around $1.35 should be scenario-based rather than absolute. The goal is to define what you’ll do if the market confirms strength or weakness—especially after a headline like a 400M-barrel release injects uncertainty into correlations.
Base case (range and chop): XRP oscillates between the mid-$1.30s and $1.40 as traders digest macro moves and wait for confirmation. In this scenario, mean reversion dominates, and it’s often better to trade smaller or focus on clearer setups (breakout + retest) instead of guessing direction.
Bullish case (hold and reclaim): XRP holds $1.35, then pushes above $1.40 with follow-through and a successful retest. The market narrative becomes simple: support held during macro stress, and buyers regained control. From there, the next upside test is typically the prior swing area near $1.47, where profit-taking and selling pressure often reappear.
Bearish case (break and accelerate): A decisive loss of $1.35—especially on strong momentum or broader risk-off—opens the door to a move toward $1.30. If $1.30 fails quickly, the market may shift from consolidation to a more directional downtrend, and dip-buyers become more cautious.
If you want one takeaway: $1.35 is less about being a magical number and more about what it represents—whether XRP can stay structurally stable while macro headlines (like a strategic crude release) try to unsettle everything at once.
Practical risk management for trading XRP around $1.35
With XRP sitting near a high-visibility level, risk management becomes the edge. Rather than increasing size because the setup feels obvious, it’s usually smarter to define the trade in advance: where you’re wrong, where you’ll take partial profits, and what confirmation you require to add.
For spot holders, the question is time horizon. If you’re investing, short-term wicks around $1.35 may matter less than weekly structure and broader market conditions. For swing traders, this is precisely the kind of zone where tight invalidation and disciplined position sizing can prevent a small idea from becoming a big loss.
A simple framework:
– Wait for a close and a retest rather than buying the first touch.
– Avoid overreacting to one macro headline; confirm with follow-through in price.
– If trading leverage, assume liquidity hunts around round levels and place risk accordingly.
Conclusion: will XRP stay above $1.35 after the oil shock?
XRP can stay above $1.35 if macro volatility truly cools—because calmer inflation expectations and steadier risk sentiment make it easier for buyers to defend support. But the level won’t hold on hope alone: it needs clear confirmation through closes above $1.35 and, ideally, a push toward $1.40 that sticks.
My view is that $1.35 is the market’s litmus test after the crude-release shake-up. If it holds, XRP’s consolidation looks constructive and tradable. If it fails, the chart likely seeks the next support quickly, and patience becomes the best position until the market shows its hand.